The Economics of Securities Lending in Kenya: Who Pays What, Who Earns What
A worked tour through how SLB fees on the NSE actually flow. The lending-fee formula, the gross-to-net calculation for a lender, the borrower’s full cost stack, and where each line on the fee schedule ends up. With concrete numbers.
A previous post on this site walked through what Securities Lending and Borrowing actually is and why the CDSC framework matters for market-makers on the NSE. This one is the natural follow-on: how the economics actually work. What the lender quotes. What the borrower pays in total. Where each line on the fee schedule ends up. The numbers below are taken from the CDSC SLB Finance Model and are the basis for how participants will price and budget for SLB activity in Kenya.
Understanding the economics is operationally important for any institutional participant. For a lender, it determines whether a quoted lending rate is actually worth the operational overhead. For a borrower, it determines whether the spread between borrowed-cost and use-of-proceeds is positive enough to justify the transaction. For an SLB Agent, it determines how the commission economics flow back into the business. None of this is hidden; the framework is deliberately transparent.
The lending fee formula
The lender quotes a lending rate, expressed as an annual percentage of the value of the lent securities. The actual fee earned over a specific contract is the rate prorated to the contract period, applied to the value of the lent shares at the start of the contract, with the SLB commissions and levies deducted from the gross. In algebraic form, the net amount L received by the lender is the number of shares S times the price per share P times the lending rate R, prorated over D days out of 365, minus the SLB commissions and levies C.
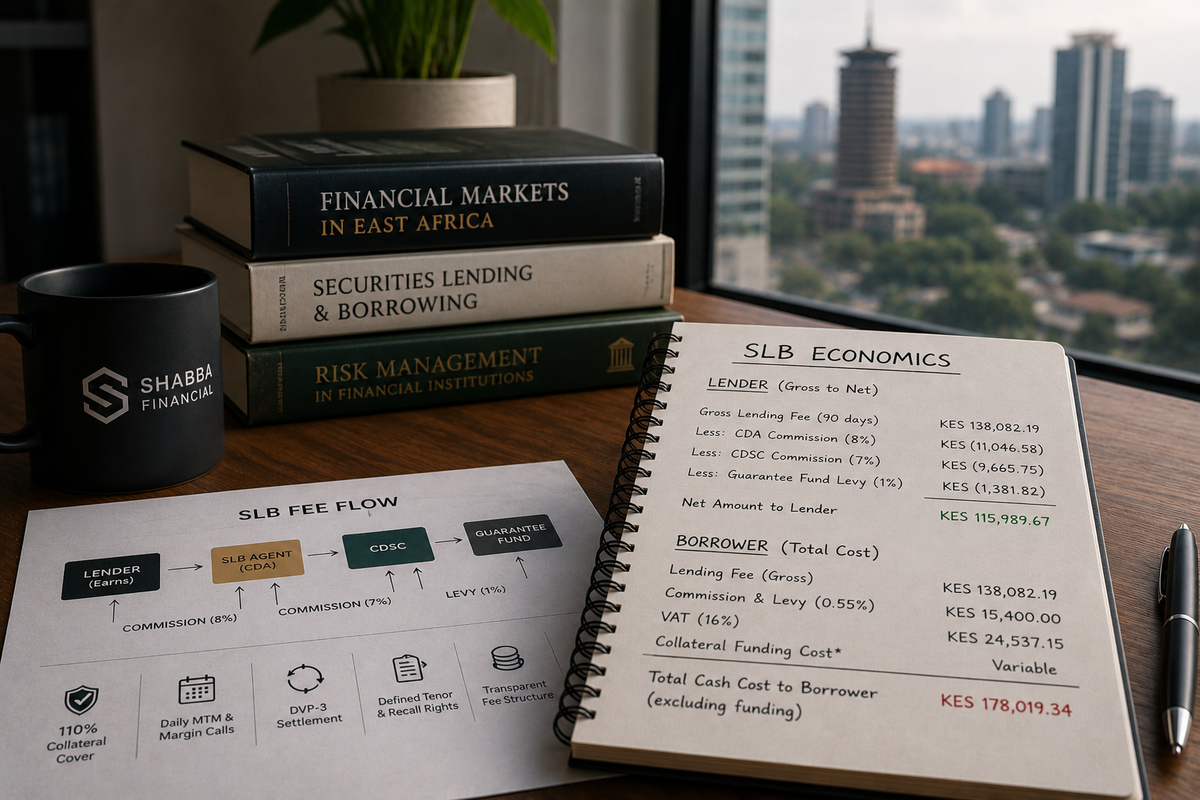
In CDSC notation: L equals (S times P) times (R times D divided by 365), minus C. C is the SLB commission and levy stack on the lender side, which CDSC sets at 16 percent of the gross lending fee. That 16 percent breaks down further: a 15 percent commission split between the CDA (8 percent of the gross) and CDSC (7 percent of the gross), plus a 1 percent Guarantee Fund levy. The net is what the lender keeps.
A worked example: 1 million Safaricom shares
Assume a lender places one million Safaricom shares into the lending pool. The shares are trading at KES 28 at the start of the contract. The agreed lending rate is 2 percent per annum. The borrow window is 90 days. The full calculation runs as follows.
Notional value at start of contract: 1,000,000 shares × KES 28 = KES 28,000,000. Lending rate prorated to 90 days: 2 percent × (90/365) = 0.49315 percent. Gross lending fee over the 90-day period: KES 28,000,000 × 0.49315 percent = KES 138,082. SLB commission and levy on lender side: 16 percent × KES 138,082 = KES 22,093. Net to the lender: KES 138,082 − KES 22,093 = KES 115,989. The lender keeps KES 115,989 in clean income on a position they had no plan to sell during the contract period.
Lending fees are not large per transaction. They compound across a long-only book that was always going to sit still anyway. That is the entire point.
The borrower’s full cost stack
The borrower pays the gross lending fee (the same KES 138,082 in the example above), plus an SLB commission and levy on the borrower side of 0.55 percent of the borrowed value, prorated over the contract period. That 0.55 percent breaks down into a 0.5 percent commission (CDA 0.30 percent, CDSC 0.20 percent) and a 0.05 percent Guarantee Fund levy.
For the same Safaricom example: 0.55 percent × KES 28,000,000 × (90/365) = KES 37,973 in borrower-side fees. The total SLB cost to the borrower over the 90-day period is therefore KES 138,082 + KES 37,973 = KES 176,055. If the borrower also intends to sell the borrowed shares (which is the typical short-selling use case), the cash market trading levies of roughly 1.8 percent apply on each side of the sale and the eventual buy-back. Those levies are charged on the cash transaction, not on the SLB contract, but they are part of the round-trip cost a short seller has to budget.
A working short-seller example: borrow the same 1,000,000 Safaricom shares at KES 28 and immediately sell them in the secondary market. The price drops to KES 26 over the 90-day window. The borrower buys back at KES 26 to return the shares. Gross proceeds from the initial short: KES 28,000,000. Cost to buy back at the lower price: KES 26,000,000. Gross profit: KES 2,000,000. Subtract the SLB cost (KES 176,055) and the cash-market levies on the sell-and-buy round trip (roughly 1.8 percent on each leg, KES 504,000 plus KES 468,000 = KES 972,000). Net profit: KES 851,945. That is the kind of unit economic that determines whether short-selling is operationally viable on the NSE, and CDSC publishes the model so participants can run their own variations.
Where every line item ends up
The published CDSC fee schedule maps each line on a transaction to a specific recipient. The full structure is more granular than the headline 16 percent and 0.55 percent rates suggest, and understanding the breakdown matters for the agents and CDSC themselves who run the operation.
Lender side (16% of gross fee)
CDA commission: 8 percent of the gross lending fee. CDSC commission: 7 percent. Guarantee Fund levy: 1 percent. Net to lender: 84 percent of the gross fee.
Borrower side (0.55% of borrowed value)
CDA commission: 0.30 percent of borrowed value. CDSC commission: 0.20 percent. Guarantee Fund levy: 0.05 percent. All prorated to the actual contract period.
Cash collateral
Held in interest-bearing deposits at tier-one banks. Earns the call rate (roughly 6.5 percent per annum in published CDSC examples). Interest accrues to the borrower. CDSC charges a 1 percent collateral management fee on the cash collateral.
Agent overhead
Each SLB Agent pays an annual subscription fee of KES 20,000 to CDSC for the appointment. Underwrites the agent's ongoing access to the SLB system and the operational support that comes with it.
Implications for who actually participates
The fee structure has consequences for who finds SLB economically interesting. On the lender side, the 16 percent take by intermediaries means a quoted 2 percent annual lending rate produces a 1.68 percent net rate to the lender. That is the kind of incremental yield a long-only fund manager with a multi-billion-shilling NSE 20 exposure can earn on the portfolio without selling a single share or changing the fund's strategic position. It is unambiguously additive, and the work is bookkeeping rather than investment decision-making.
On the borrower side, the 0.55 percent of borrowed value plus the negotiated lending rate sets a hurdle for whether any borrow-driven strategy is viable. For a short-seller, the hurdle is straightforward: the expected price decline over the borrow period must exceed the round-trip cost (SLB fees plus cash-market levies) by a margin that justifies the operational risk. For a market maker borrowing to cover a delivery obligation, the hurdle is different: the cost has to be small enough relative to the spread the maker earns on the underlying trade for the operation to remain profitable.
On the agent side, the economics are more like a transaction-fee business. The CDA commission of 8 percent on the lender side and 0.30 percent of borrowed value on the borrower side accumulates across the agent's client book. The annual subscription is fixed at a relatively modest KES 20,000, so the marginal economics scale almost linearly with volume. The seven CMA-appointed agents compete for that flow.
Where Shabba sits
SLB cost as a budget line in the operating model
Shabba's engagement with the SLB framework is on the borrower side. Each borrow we initiate to cover a short on the cash-equity book, an ETF redemption, or a derivatives settlement obligation carries the SLB cost stack described above. The cost is a budget line in the pricing engine: every quote that might produce a fill requiring an SLB-backed delivery prices in the expected SLB cost upfront, so the trade is profitable after the borrow rather than after a hopeful adjustment later. Treating SLB economics as a known input rather than a discovered cost is what keeps the operating model honest.
Why publishing the model matters
There is a useful contrast between markets where the lending economics are transparent (every fee, every recipient, every formula published in advance) and markets where the lending economics are bilateral and opaque. The opaque version produces wider effective spreads for participants who lack the relationships to negotiate, and concentrates the income in whichever intermediary is closest to the deal. The transparent version commoditizes the operation, compresses the take, and ultimately routes more flow through the venue because every potential participant can verify their own unit economics in advance.
CDSC publishing the fee schedule and the lending-fee formula in the documents that accompanied the screen-based pilot is the right architectural choice. It means a fund manager weighing whether to lend can model the expected income to the basis point before deciding. It means a market maker pricing a short-driven hedge can model the operational cost to the shilling before quoting. It means an SLB agent competing for client flow does so on service quality and relationship rather than on opacity. The fee transparency is one of the quieter but operationally important features of the framework.
Securities lending economics on the NSE are precisely the kind of transparent, formula-driven structure that lets every participant verify their own unit economics. That transparency is what makes the framework usable, and what should make Kenya a genuine destination for cross-border SLB flow over time.